Compare Qlik Sense® vs Power BI
This guide provides an in-depth comparison of two top BI tools and practical advice to help you select the right solution for your organization.
Qlik vs Power BI: Evaluation Guide
At a quick glance, it appears that both Qlik and Power BI allow you to scale insights by exploring data from multiple sources, but there are fundamental differences. Read on to find out how Qlik and Power BI compare.
Popular resources to help you compare BI tools
-
Comparison Guides
See how top BI and analytics tools compare on the 12 key factors you should consider in your evaluation process. -
Hear from your peers
See why real-world BI users ranked Qlik Sense® #1 in Business Value and Analyses in BARC’s BI & Analytics Survey 22. Overall, Qlik Sense ranked #1 in 6 KPIs and a leader in 45 more. -
Get the buyers guide
BI initiatives come with many functionality requirements and priorities, so finding the right platform can be tough. Our guide on how to choose a modern analytics platform will help.
Qlik vs Power BI Comparison
In their 2022 Magic Quadrant report, Gartner named only three vendors as “Leaders”: Power BI, Tableau and Qlik. This guide compares Qlik vs Power BI on the 12 key factors below.
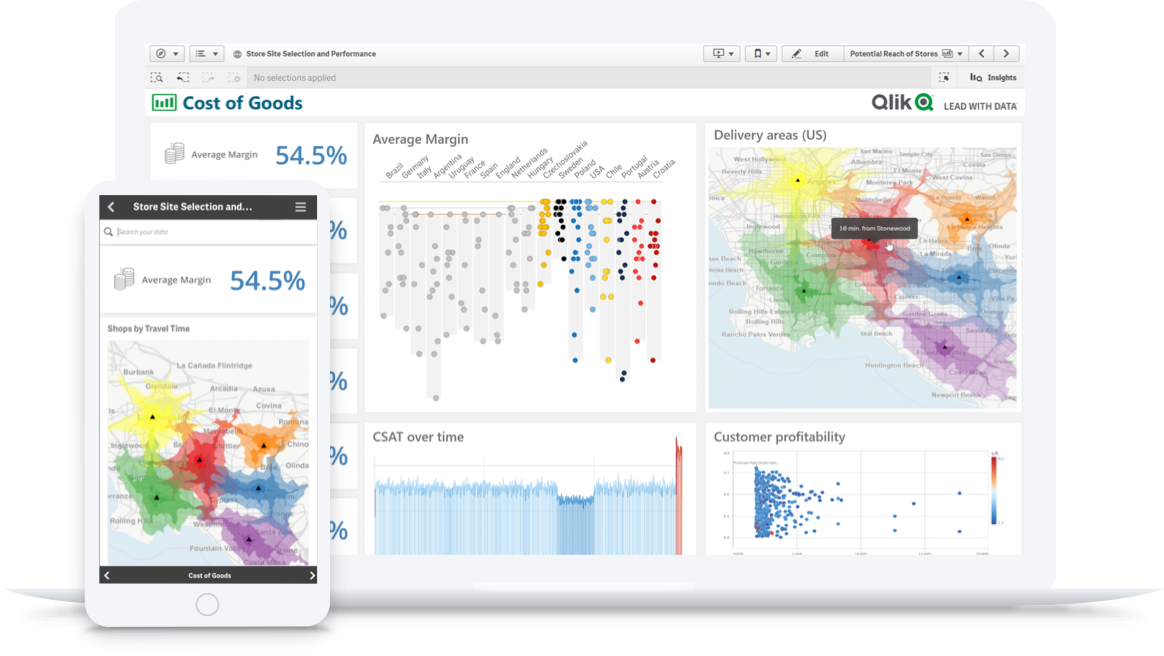
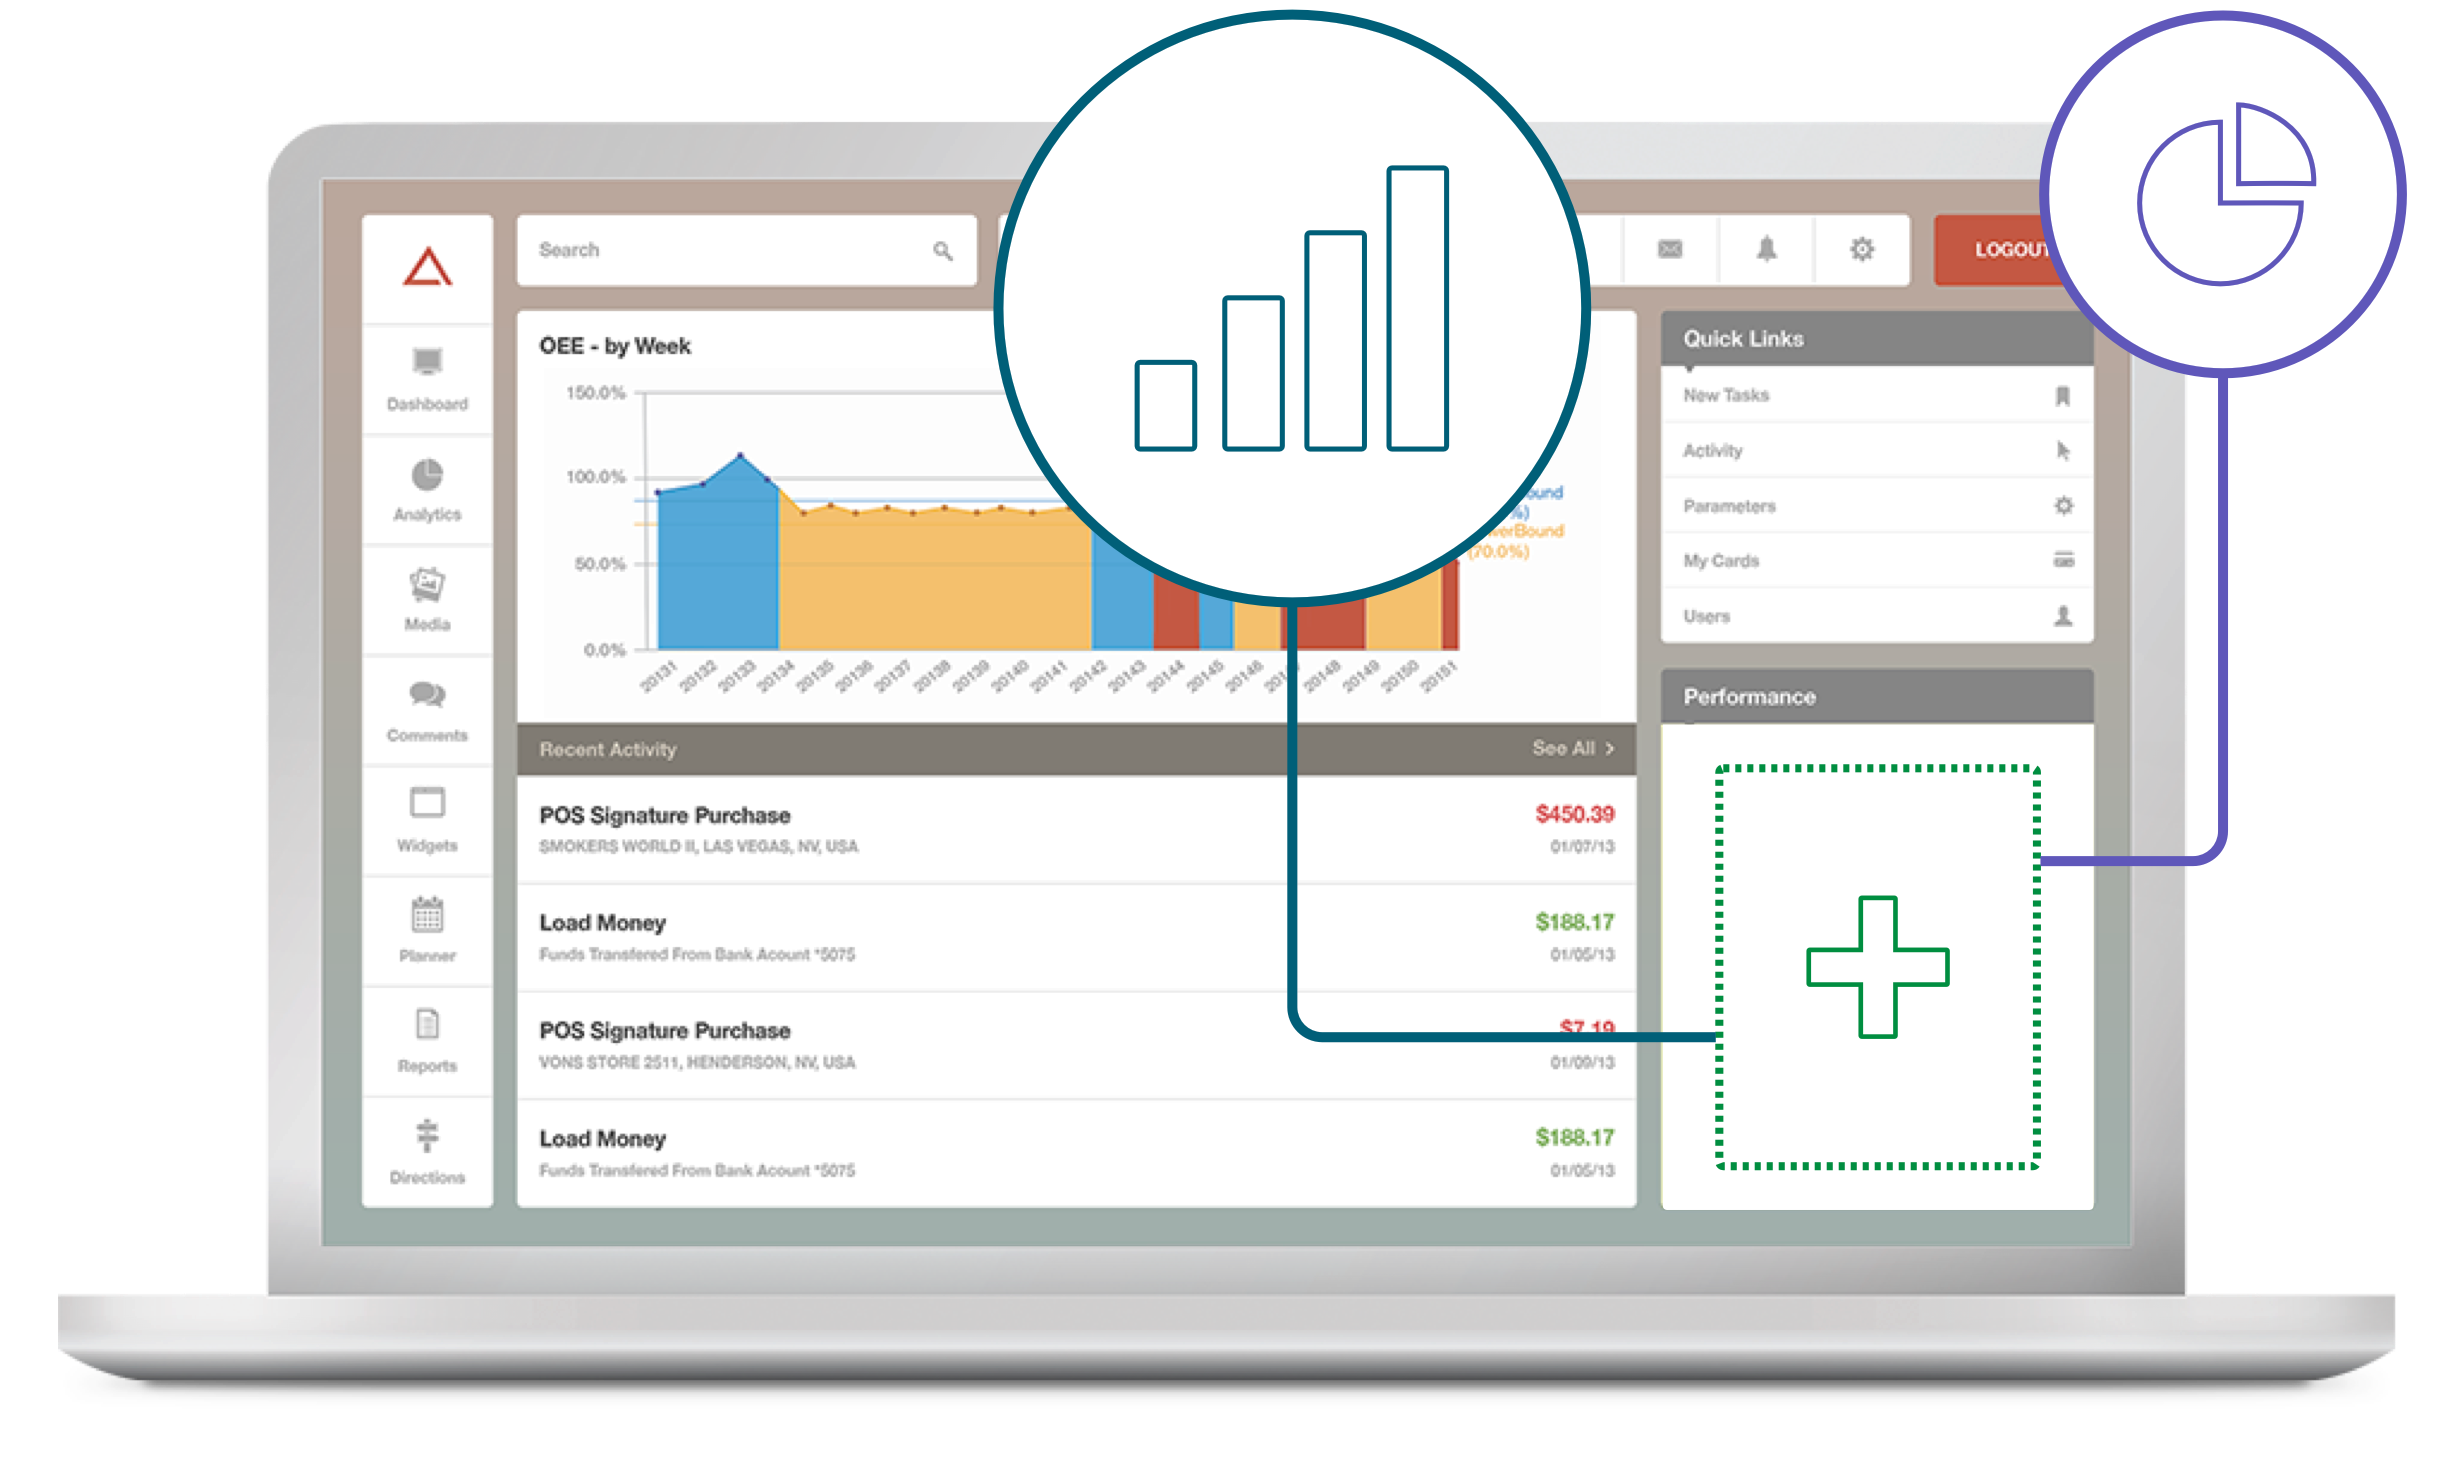
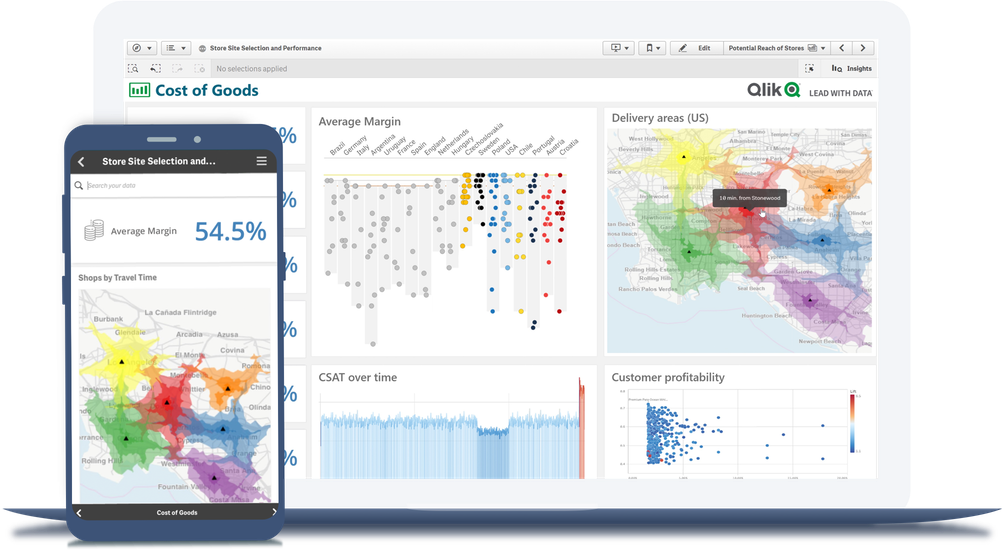
Interactive Dashboards
Lots of tools can make cool-looking dashboards. Your BI tool should let you explore all your data in any direction, directly from within the dashboard. That way, you can uncover relationships which you may not have considered when you or an analyst first set up a query.
-
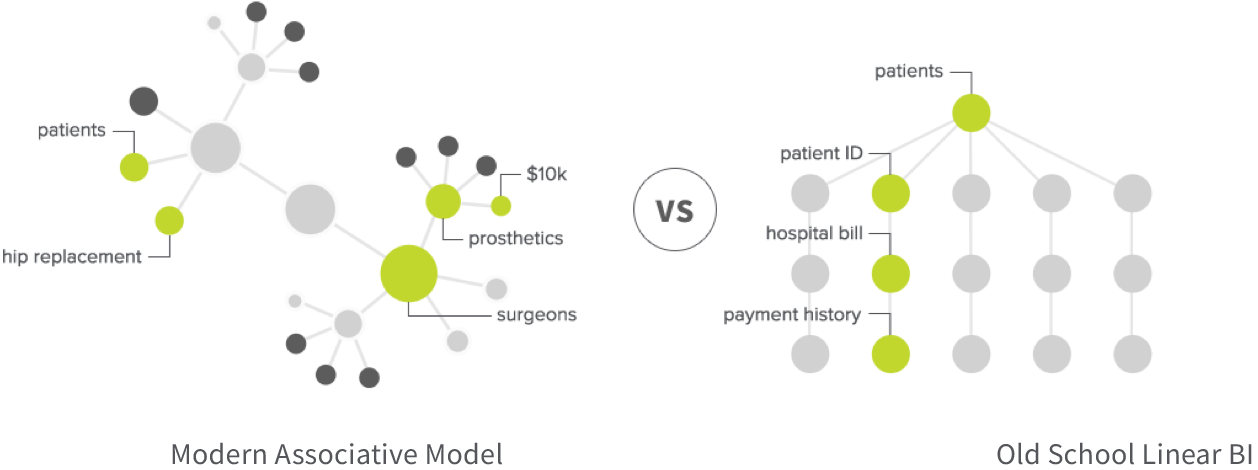
Qlik
Qlik’s “associative” data engine allows you or any user to explore all your data freely from any angle, allowing you to answer the next question. And Qlik’s cognitive engine uses machine learning to learn over time and give you exploration ideas. -
Power BI
Power BI’s SQL engine forces you to follow specific paths and limited data. This means that for each query, only a slice of your data is analyzed, so patterns and connections go undiscovered.
“The ‘Associative Engine’ is what sets Qlik apart from other BI solutions.”
-Grzegorz Dadowski*
Data Visualization
Most BI tools can visualize data in interactive graphs, charts and maps. But like dashboards, you’ll need to freely explore all your data, in any direction, directly from within the visualization. Plus, modern tools offer AI to help you create charts, highlight outliers, and suggest new visuals.
-
Qlik
Qlik’s data engine lets you explore all your data in a full suite of interactive visualizations. And it compresses large data sets, reveals the shape of your data, pinpoints outliers, and provides AI help for creating charts, recommending associations, and preparing data. -
Power BI
Like most top tools, Power BI offers a full range of interactive data visualizations. However, like their dashboards, the preselected query paths will restrict your filtering and exploration.
“Qlik is more powerful and robust compared to Power BI.”
- Peter Eerdekens*
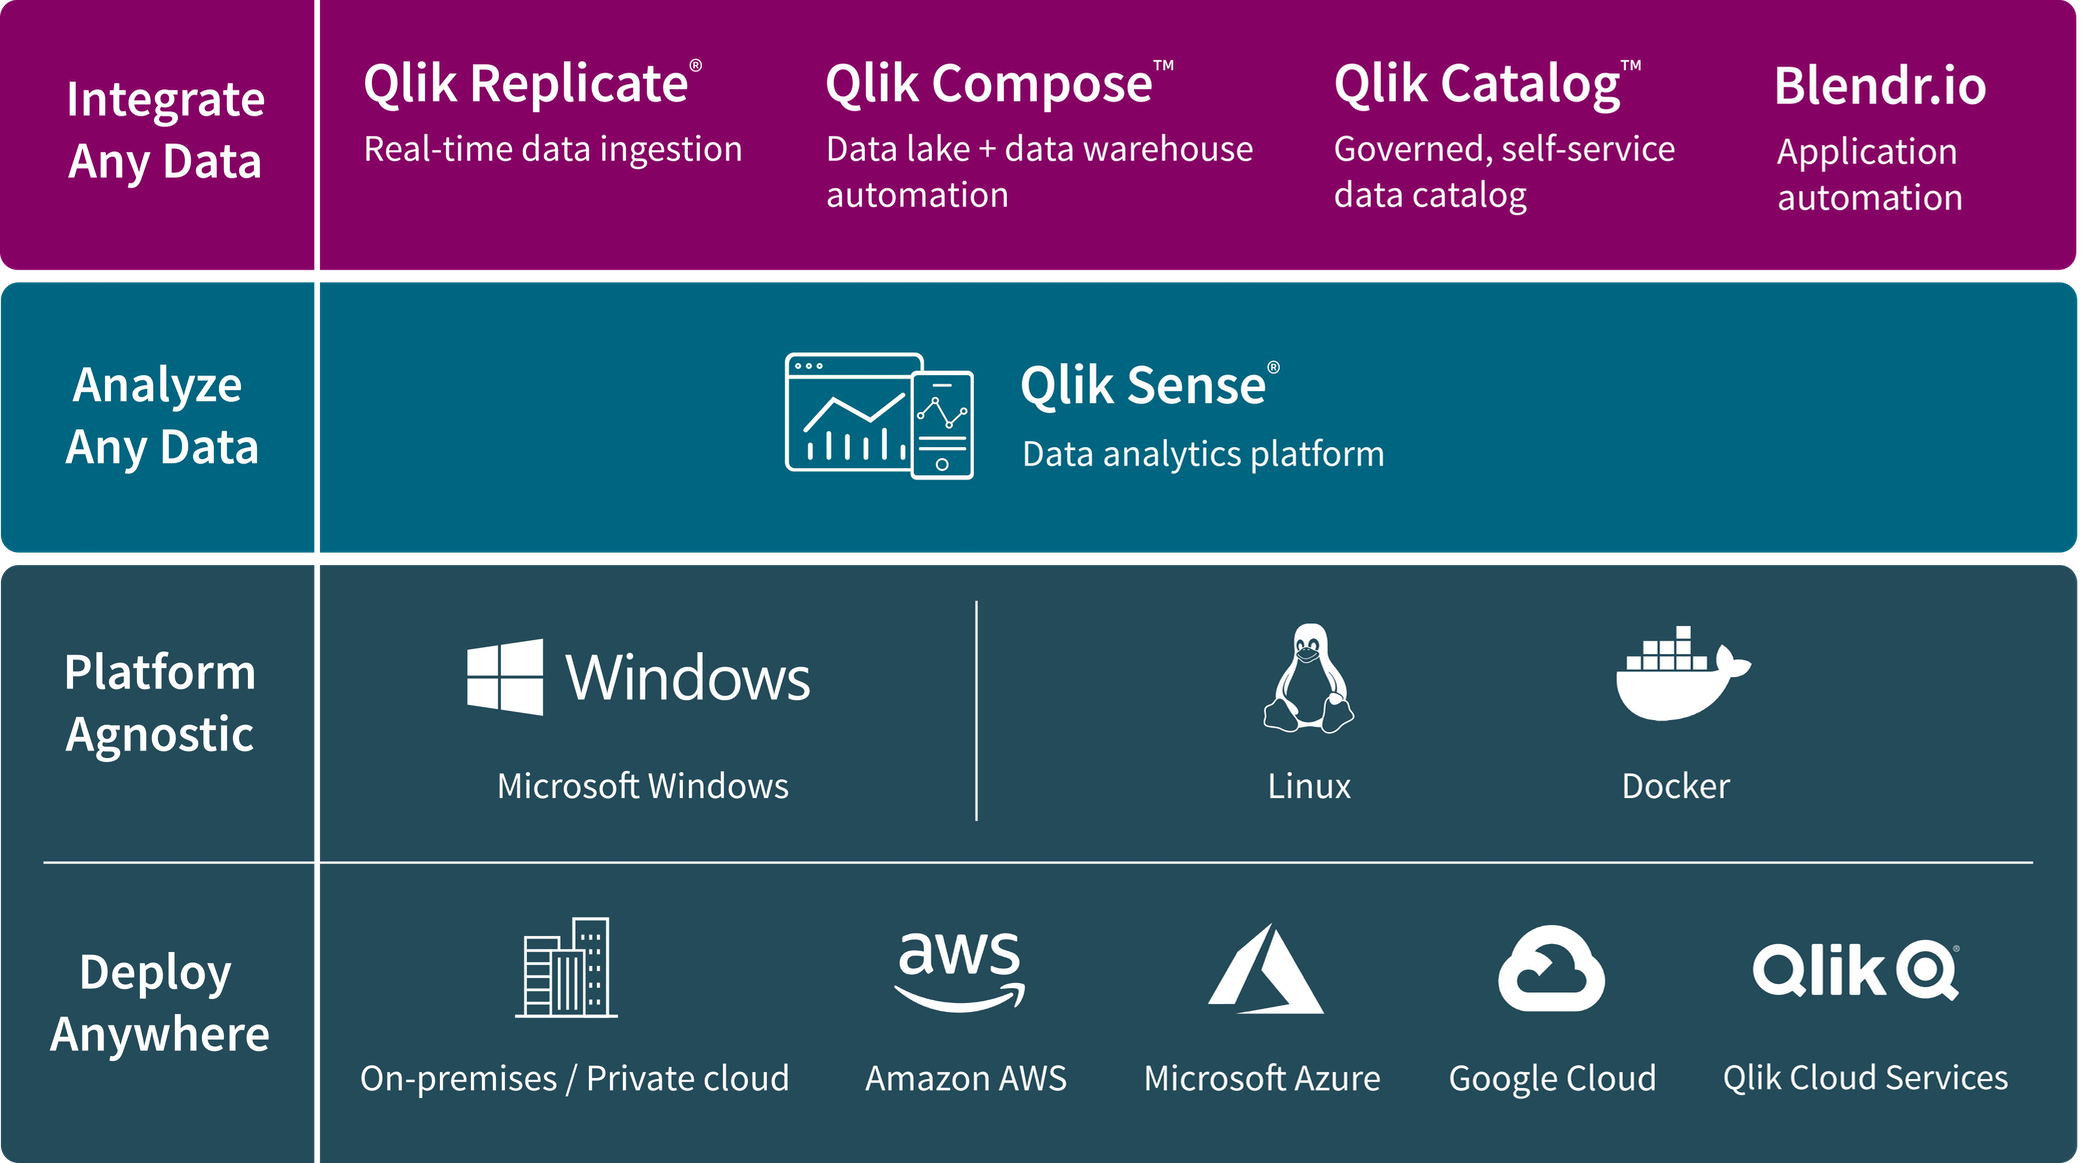
Deployment Flexibility
You need high-performance data analytics no matter which infrastructure you have. You also need an agnostic, independent web-based platform if you want to move, manage, integrate, and analyze data across multiple sources, at enterprise scale and speed.
-
Qlik
Qlik is an independent company and offers you total freedom and control of your data. Qlik also provides a full enterprise SaaS environment and on-premise or private cloud options. Learn more. -
Power BI
Power BI will require you to use Azure and will become another way to lock you into one vendor. And, their cloud experience is different from their on-premise functionality.
“The performance of Qlik just simply crushes Power BI.”
- James Anderson*
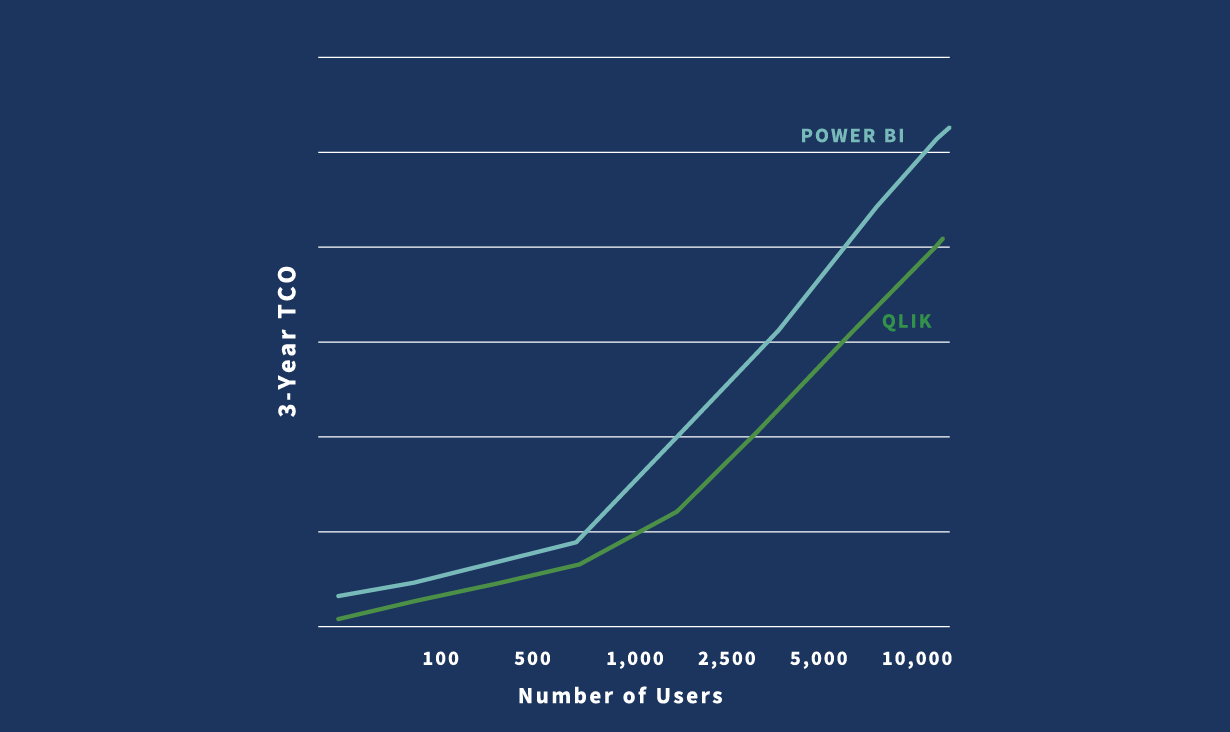
Total Cost of Ownership
There's more to making a BI platform investment than just the initial purchase. The Total Cost of Ownership (TCO) factors in all the costs associated with using a BI solution for 3 to 5 years, such as infrastructure, systems setup and app development, and systems admin and support.
-
Qlik
Qlik’s total cost of ownership is lower than Power BI. And Qlik has no additional or hidden costs as you scale. -
Power BI
Power BI may seem low-cost on the surface. But to scale up even moderately, you have to pay for an upgrade. Learn more.
“The price comparison is very misleading.”
-Tomasz Wojcik, Thermoplast*
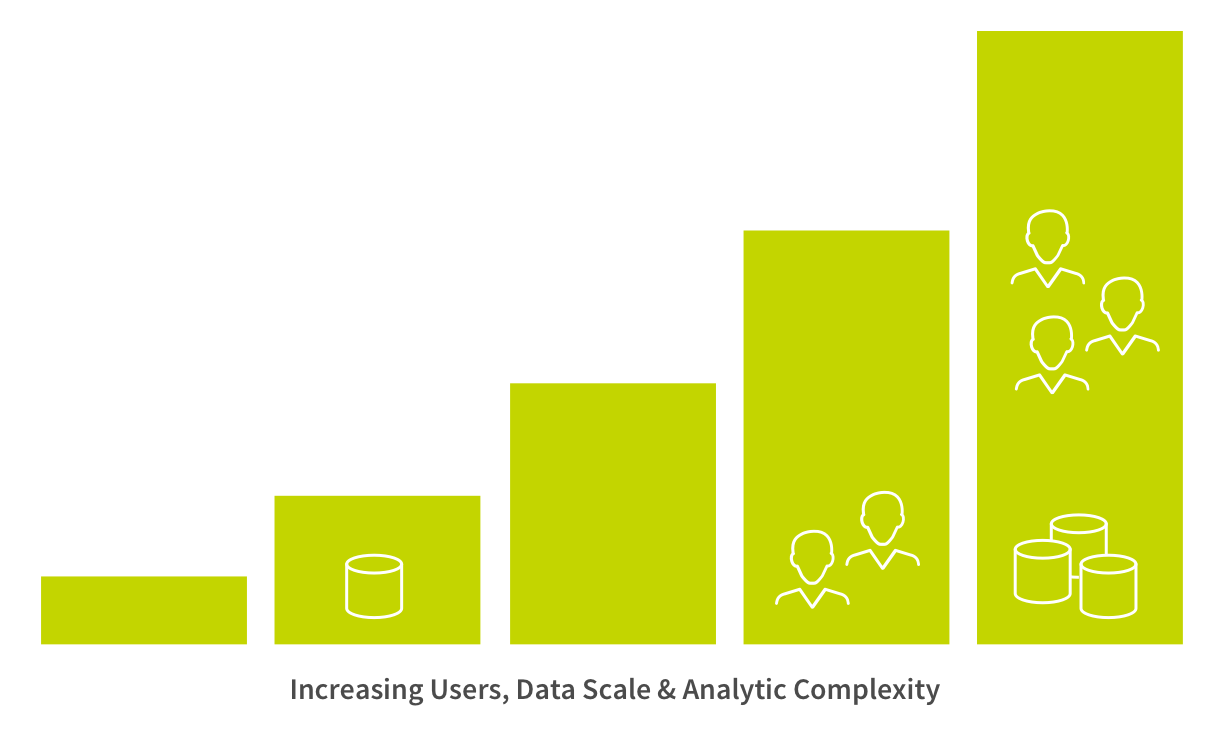
Scalability
Uncovering insights works best when users have a complete, up-to-date view of all relevant data. This requires the ability to integrate and combine data from any source, as close to real-time as possible. To do that successfully, you need an analytics platform that’s built to handle data at any scale without compromising performance or driving up costs.
-
Qlik
Qlik’s associative engine provides instant calculation performance, even with massive data sets, real-time data and high numbers of users. Plus you can keep data fresher in a much smaller build window, due to Qlik’s ability to add, modify and remove records. Learn more. -
Power BI
Microsoft will make you pay extra if you want to scale. Once you pass Power BI Pro’s low data limit of 1GB per data set, you have to upgrade to Premium (or use live query, which will slow everyone’s work to a crawl). Even if Microsoft can work with big volumes it will always come with a much bigger cost or a much lower performance.
“Power BI can't handle larger data volumes at the visualization layer like Qlik, performance-wise”
-Srikanth Penumutchu*

Governed Self-Service
Everyone in your organization wants to trust their data, analytics and insights. They also want to work quickly and not have to wait for IT or analysts. So, your tool should allow you to control your data and content with a centralized management capability that uses rules-based governance.
-
Qlik
Qlik centralizes and unifies your data in the cloud, creating governed data models with robust data security. And all content creation happens in the cloud, where it’s governed and controlled at every step. Plus, governed libraries provide reuse and standardization for analytics. -
Power BI
Power BI takes a decentralized approach, spreading data across people’s desktops and the cloud. The end-users don’t have the possibility to create their own viz or make changes to the existing ones; they are always dependent on the authors for that. This makes managing data expensive and time-consuming.
"The power of the Qlik engine, Set Analysis and QMC far outweigh what can be done in Power BI.”
-Mark Little*
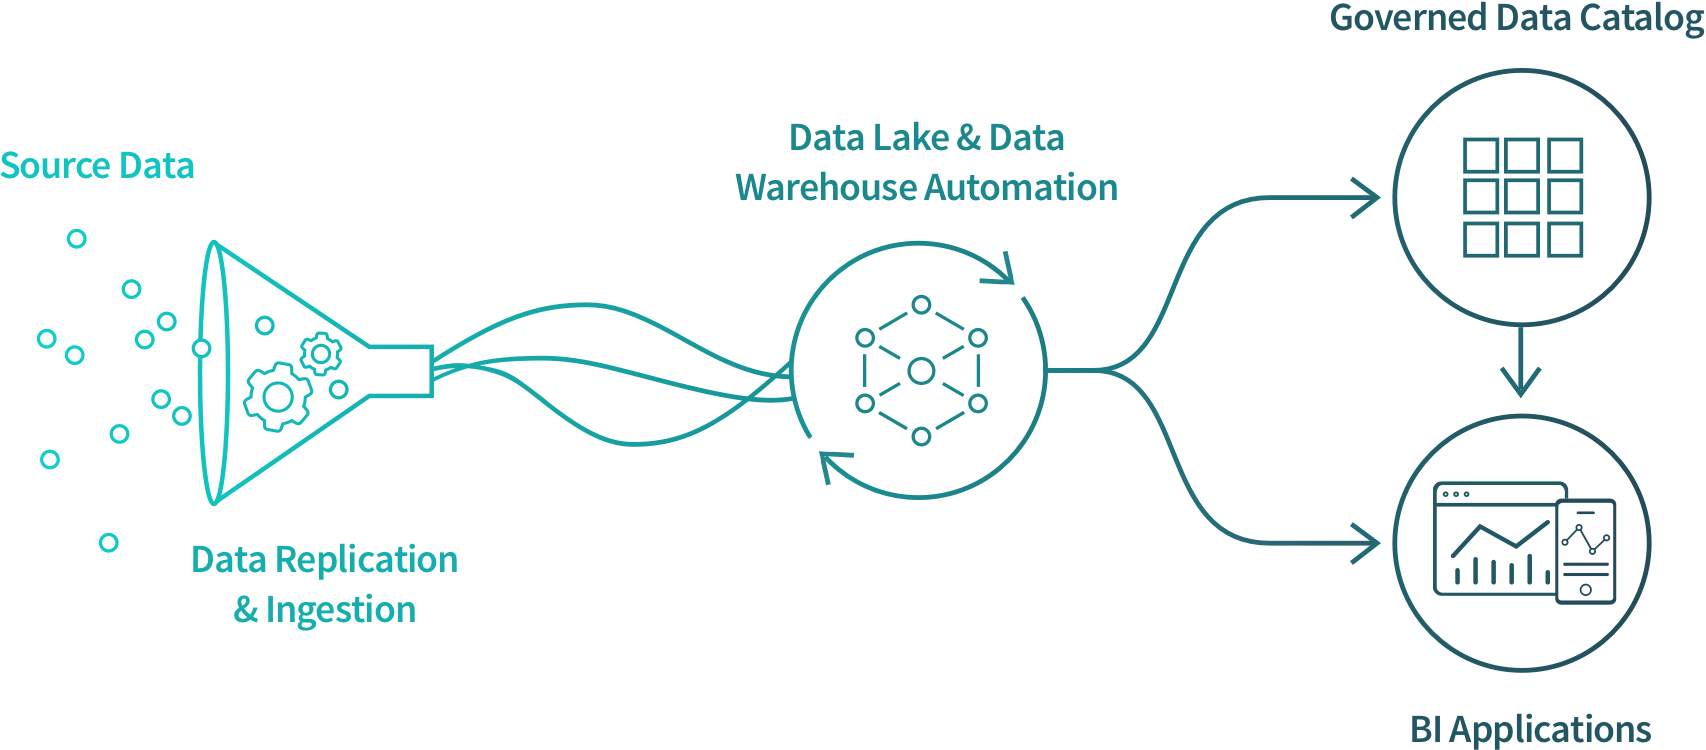
Data Integration
Data integration refers to bringing together and transforming raw data into analytics-ready data. Today’s BI tools should be able to leverage real-time data integration technologies like change data capture and streaming data pipelines and make data available across your enterprise.
-
Qlik
Qlik Sense has built-in, best-in-class data integration capabilities for combining and transforming data as well as data cataloging. Plus, Qlik also offers an enterprise class data integration platform which provides a seamless analytics data pipeline. -
Power BI
Making data integration work on Power BI requires you to purchase additional products from the Microsoft stack. And even then, it can be difficult to manage the disparate offerings.
“Qlik’s end-to-end is what makes it superior to Power BI.”
-Mitch Speer*
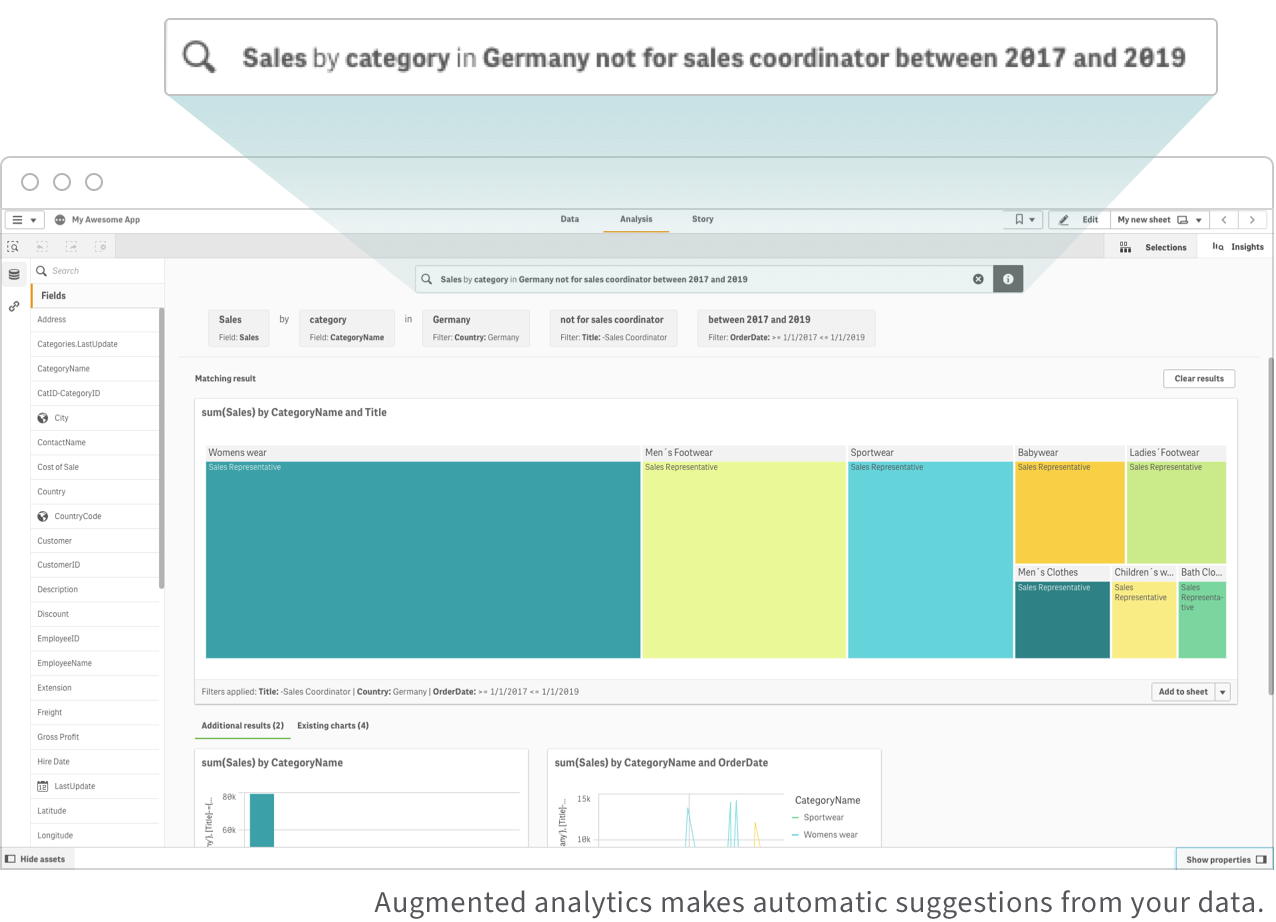
AI-Powered Analytics
Augmented analytics brings the power of AI and machine learning to suggest new insights and connections. This helps you quickly analyze your data, increases your productivity and helps you make better data-driven decisions.
-
Qlik
Qlik’s full range of AI capabilities are built into the platform at a foundational level. This lets Qlik's AI be an always-on engine within the context of the analysis you’re performing and suggest insights and new connections as you explore your data. -
Power BI
Two Microsoft AI features, Quick Insights and Q&A, were added on to Power BI. And, these features are objects on a dashboard which you’ll need to add every time. ML capabilities are additional Azure products.
“Qlik is way more user-friendly. It’s easier to use filters, to do powerful drill downs, and it has intuitive dashboards”
-Benoît Gochel*
Embedded Analytics
Embedded analytics refers to incorporating full analytics capabilities within other processes, applications, and portals across an organization. This allows your employees, partners, suppliers, and customers to make better, data-driven decisions from within the systems they already use.
-
Qlik
Qlik’s platform was built API-first using modern standards. This allows you to embed a dashboard and individual numbers, values, and metrics within the latest web and application technologies. -
Power BI
Power BI does make it possible to embed dashboards and objects within other apps. However, Power BI is not API-first and many capabilities are not available in its SDKs, the more relevant being the lack of self-service.
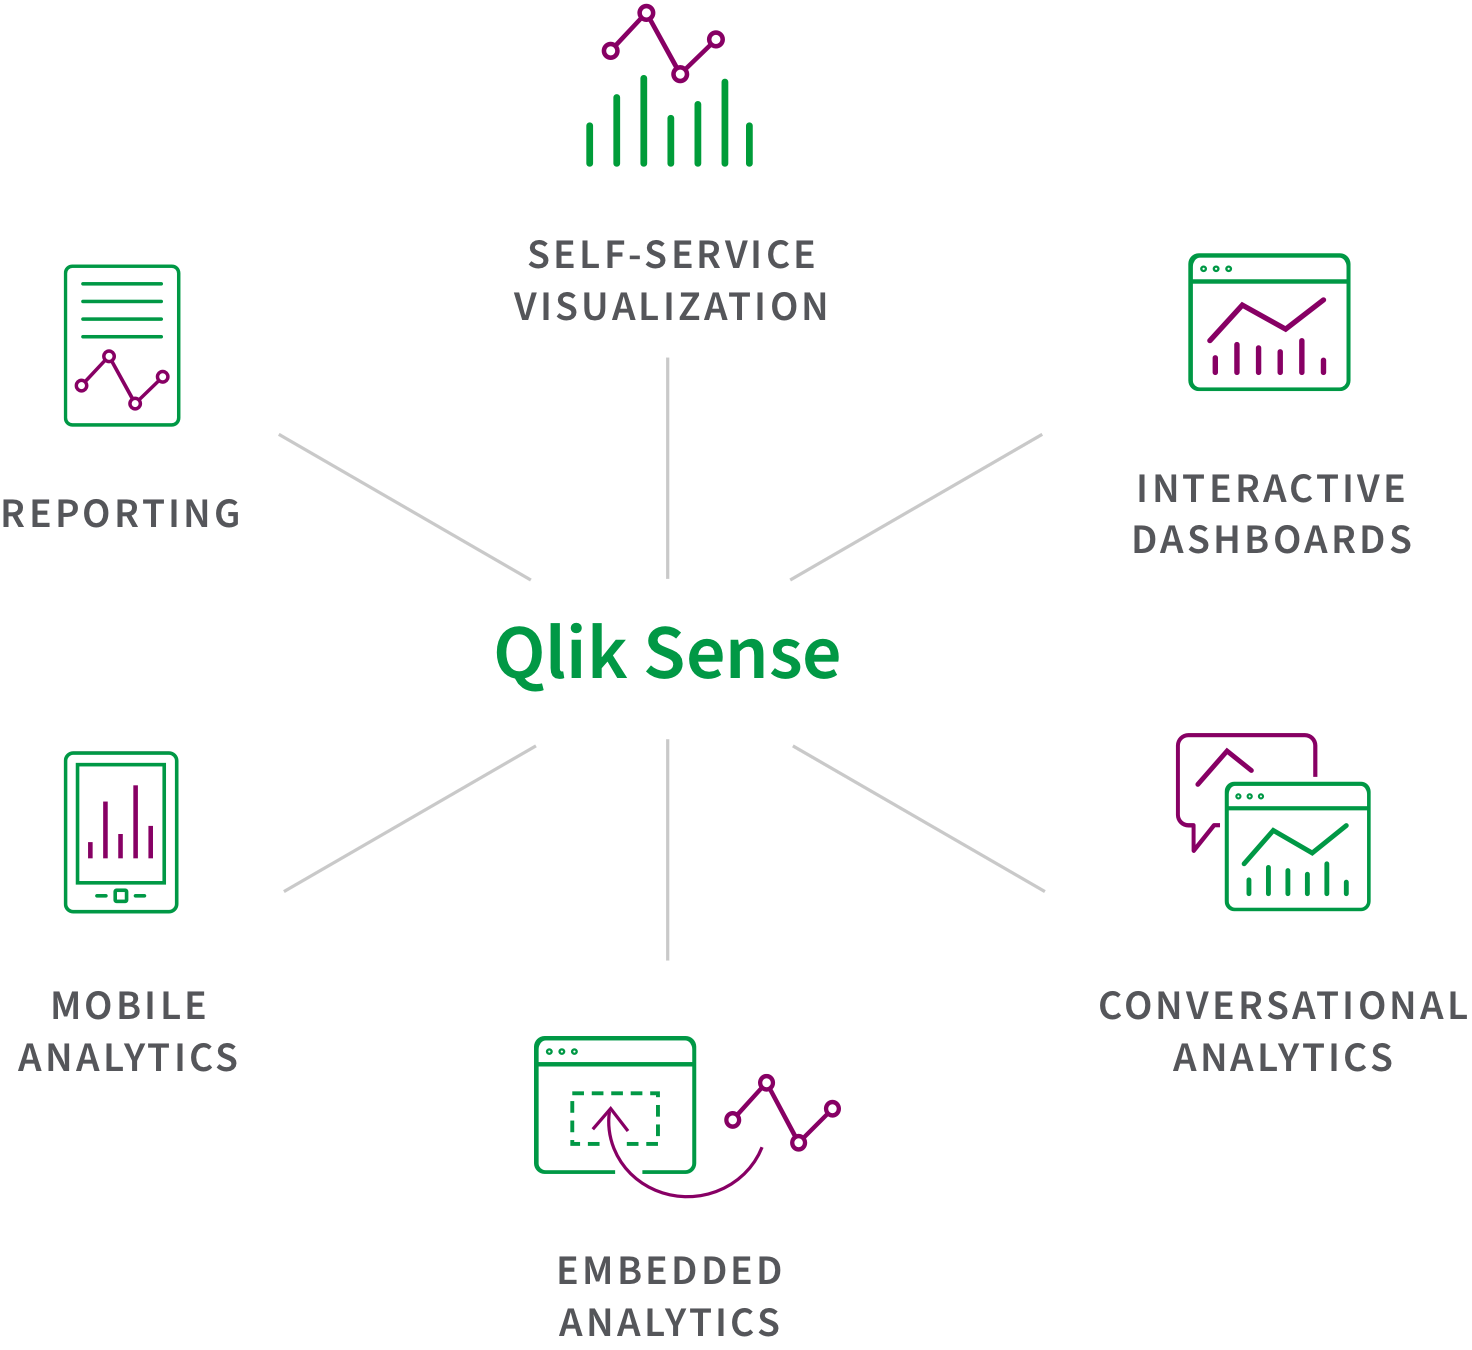
Many Use Cases, One Interface
All users in your organization should be able to perform all BI use cases using the same data and the same platform. This is because different types of users, such as analysts, engineers and businesspeople will want to perform many use cases, such as embedding analytics, exploring data or sharing dashboards.
-
Qlik
All users can perform all activities pictured here plus App Automation, Auto ML, Alerting and Reporting all on the same platform with a common analytics engine, AI capabilities and analytics data pipeline. -
Power BI
Power BI does deliver on a range of common use cases but you will need to invest in the full stack of Microsoft data and analytics products.
“Qlik has more features and is very easy to use. It handles more data, and publishing apps is simple.”
-Taj Mohamed*
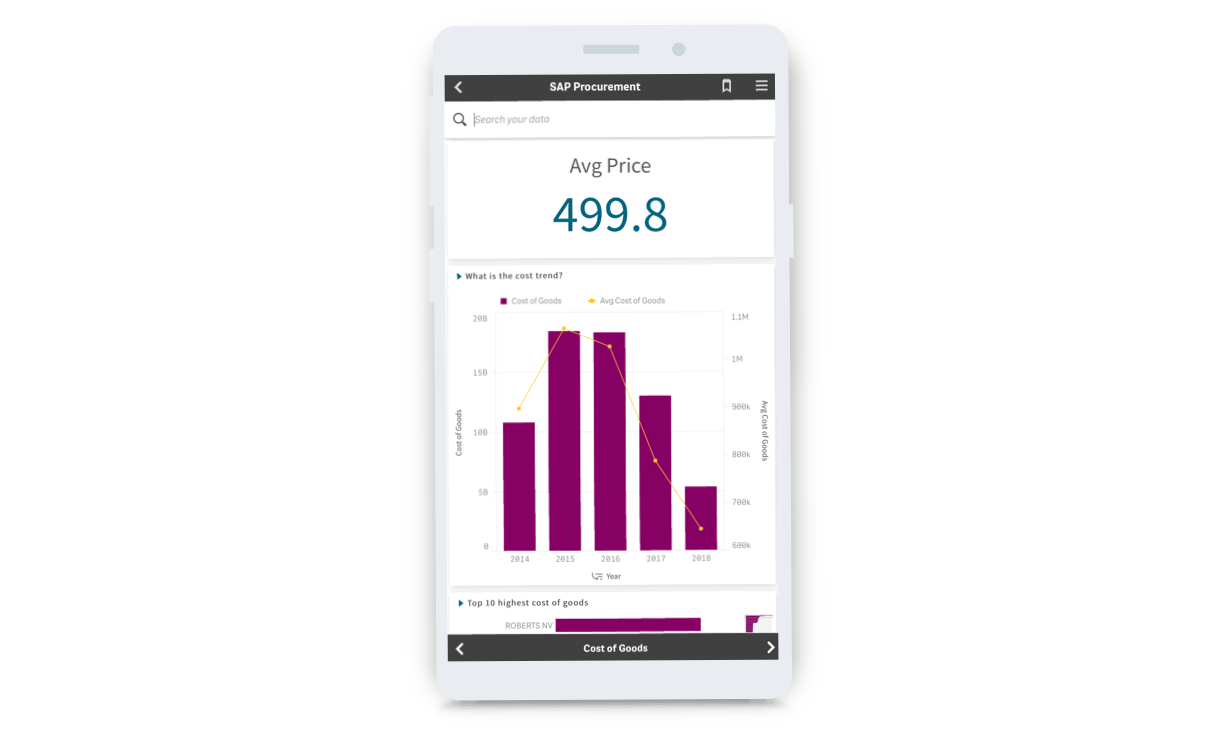
Mobile BI
Curiosity can strike at any time. It doesn’t wait for you to be at your desk, computer on. That can make desktop-based data analytics software frustrating. You need a platform that lets you freely explore data and uncover hidden insights whenever inspiration (or curiosity) strikes, no matter where you or what device is closest to you.
-
Qlik
Responsive design and touch are native to the Qlik platform and Qlik offers a full-native mobile app. The app offers fully interactive online and offline exploration and integrated alerting with push notifications. -
Power BI
Power BI has a mobile app but it only allows for viewing, not creating. And Power BI’s cloud is used primarily for uploading reports.

Data Literacy Support
Today, you need everyone in your organization to be data literate. This means that they are able to ask the right questions of data and machines, make data-driven decisions, and communicate meaning to others.
-
Qlik
Qlik makes it easy for anyone, at any skill level, to explore their data. Plus Qlik offers data literacy training for any user. -
Power BI
Power BI only provides self-service access to authors. And once these authors have published content, it’s only available with very limited interactivity. All other users must go back to the author for a new report when they want to explore deeper.
“Such a great focus on developing data literacy!”
-Mitch Speer*
Popular resources to help you compare Qlik vs Power BI
-
 Analyst Report
2022 Gartner Magic Quadrant for BI and Analytics
-
 E-Book
Built for Transformation: How Qlik Gets You Farther, Faster in the Digital Era
-
 Whitepaper
3rd Generation BI – Accelerating Data Literacy in the Analytics Economy
-
Whitepaper
Qlik Sense Enterprise SaaS Technical Overview
Should you compare Power BI vs QlikView®?
Why do customers choose Qlik?
Compare Qlik Sense® to other data analysis tools and you’ll see why Qlik sets the benchmark for a new generation of data analytics. Our one-of-a-kind associative analytics engine and sophisticated augmented analytics let you freely explore all your data to make bigger discoveries and uncover insights you can’t find using other data analytics tools.
And with a true governed multi-cloud architecture, deploy any way you want, massively scaling users and data without compromising security or performance. Qlik helps you empower people throughout your organization to make better decisions, take smarter actions and drive stronger business performance, every day.
*Qlik User Survey